
Present guesses: unsure tutors.
Make a budget. Plan the morrow.
Share some knowledge. Dodge some sorrow.
Chapter 9 Guided Practice Problems
9.1 Budget Theory
9.1.1 Budgets and Accountability
A budget is a firm’s formal plan. It is usually a financial plan but not always.
Forming a budget, or plan, is important because it helps the firm prepare for future events, good or bad. It can help the firm foresee a cash shortfall (allowing the firm time to secure financing in advance). Or it can help the firm foresee a cash surplus (allowing the firm to secure good options for investing this surplus).
Failing to properly budget increases the risk the firm is caught flatfooted by future events. Being caught flatfooted is generally not the best way to maximize profit.
Formality is an important aspect of a budget because it leads to accountability. By “formal” I mean that a budget is permanently recorded and then shared. Yes, budgets are often discussed and drafted first. But eventually a final number for each line on the budget must be settled upon and permanently recorded. Then those budgeted numbers are shared with relevant parties.
Those forming a budget will have to answer for the budgeted numbers they record—and for the effect of those recorded numbers have on the firm’s preparedness for the future. A budget’s formality forces one to think carefully about what goes on record, given that the record may face unforeseen scrutiny.
9.1.2 Budgets and Knowledge
A budget could also be described as a firm’s “expectation” because it’s based on the firm’s best guess about the future. The formality of a budget puts pressure on budget-makers to use the best knowledge available to inform the budget because that improves the budget’s chance of withstanding future scrutiny.
As such, a budget should reflects the firm’s collective knowledge about itself. A firm’s expectation of the future, i.e. its budget, is usually based on the firm’s collective knowledge about what drives firm revenue and firm costs and the firm’s collective knowledge about what is most likely to happen with those drivers in the future.
As that knowledge grows and as facts on the ground change, budgets change. That is, new budgets look different from old budgets based on the firm’s growth in knowledge about itself and the future.
Think about this from an academic perspective. Many wise students plan the next few semesters’ classes. This is a type of budget. It is a student’s plan, their best guess of what the optimal path through college looks like.
As things progress, students learn more about that budgeted path. They receive new information from the advising office, from friends, from new developments in their own academic career, or from outside research. Their knowledge about themselves and their knowledge about a previously uncertain future grows. Their plan is likely to change and incorporate this new knowledge.
Always remember that a budget reflects the firm’s knowledge about itself and the future. A budget’s quality depends on the quality of that knowledge.
9.2 Decentralization
9.2.1 Budgets in Large Firms
Budgeting in a small business tends to be straightforward because the owner possesses most if not all of the firm’s knowledge. He or she knows a lot about how much inputs cost (he or she may be buying these inputs directly). He or she knows a lot about what brings customer value (he or she is probably interacting with them directly). He or she knows a lot about the employees and their capacity for work (he or she likely hired, trained, and/or supervises these employees directly).
In a small firm, then, the budgeting process mainly consists of the owner jotting down knowledge already in his or her head. Perhaps there is some need for discussion, or maybe there are a few new developments he or she wasn’t aware of before starting the budgeting process. But beyond that the owner is the main source for budgeting knowledge.
As the firm gets bigger, the budgeting process changes significantly because firm knowledge is no longer concentrated in the owner. Instead knowledge becomes more and more decentralized. That is, knowledge is spread around the firm.
In large firms, the employees and managers in one department might know more specifics about drivers of revenue, while employees and managers in another department might know more specifics about drivers of costs. Customer interaction might be primarily taking place in a third department.
Furthermore the “owner” of a large firm is often a distant set of constantly-changing shareholders who manage the firm through the intermediary device of a board of directors. This board of directors and the executives they hire are almost certain not to possess the ground-level, specific knowledge that makes
The further up the org chart you go the less likely it is that the person has up-to-date knowledge about drivers of revenue and costs.
The budget in a large firm is not a routine matter of documenting knowledge that’s already in the owner’s head. Instead a large firm’s budget is a knowledge sharing tool.
9.2.2 Budget Participation
In a large firm, there is almost always some degree of budget participation. Budget participation is how much a person is assigned to share his or her budget-relevant knowledge about the firm with a supervisor.
Budget participation is simply how bottom-up the budget is. At one extreme the employees at the lowest level of the org chart provide the estimates that make up the budget and supervisors have no say in the matter. At the other extreme top executives draw up a budget and impose it unilaterally on the entire firm.
I doubt either of these extremes exists in practice. Most firms are somewhere in the middle: asking for some bottom-up input and using some top-down direction. Bottom-up input includes middle managers and line managers. Compared to top executives these managers often have much more direct knowledge about the firm’s ground-level operations.
Budget participation is a prerequisite for using a budget as a knowledge sharing tool. If the firm is not allowing input from across the firm, where knowledge is distributed, then the quality of the budget is likely to be low.
Look at the map below. What do you think makes the blue and orange countries different from the gray countries?
(Note: there’s no intended distinction between blue countries and orange countries. I use two different colors solely to improve visibility.)

The blue and orange countries have had a local version of the television show Undercover Boss or have had the United Stated version of the show on air (per Wikipedia). That’s widespread for a TV show!
Why? For one thing the premise of Undercover Boss is widely understood. Top executives in a firm will almost always be surprised at the conditions on the ground in their firm. That’s just part of the decentralized nature of knowledge within a large firm.
It’s also a good recipe for television drama, apparently.
Hence the importance of knowledge sharing tools, like a budget, to ensure the firm is using the best possible information about itself and about the future.
9.2.3 Budget Slack (or Sandbagging)
Knowledge sharing isn’t the only thing budgets are for. Budgets are also used, in part, as tools for evaluating performance. That should be clear from Chapter 7. Budgeted numbers affect the firm’s variance figures for the period, and variances inevitably point to a particular manager.
That’s by design. Variance analysis is intended to help assign responsibility for costs, which has to be based on the firm’s best understanding of where costs come from, i.e. the budget.
But these dual roles of a budget are a problem. They open the door to perverse incentives that motivate people to distort their budget-related estimates, ultimately corrupting the information value of the budget.
Let’s use an academic example. Imagine you just took an exam in my class. After gaining mind-blowing insights from the exam and rethinking your life (“Mom was right, I should be a cost accountant!”), you receive an email from me indicating it will be a couple weeks before I have exam grades back to you.
See, I’m sharing knowledge. You probably have less experience grading this exam than I do. You’re relying on me, at least partly, for an estimate of how long the process takes. That is, I’m providing you with a budget or expectation based on my specific knowledge of the ground-level process of grading.
Great. Except that I also know this budgeted number might affect your evaluation of my performance. If I take more time than I say, you might think less of me and your evaluation of my teaching performance might be lower.
See what this setup motivates me to do? It provides me incentive to distort my estimate to make sure I meet or beat it. Suppose I can actually grade that exam in one week, then telling you it will take me two weeks to grade it gives me a chance to impress you (“Wow, not only does he golf 38 under par, but he’s dedicated to his students too!”).
Or, it gives me a chance to be really lazy without hurting my teaching evaluations (“Binge watching party!”).
This is called budget slack or sandbagging: intentionally underestimating revenue or overestimating costs to make it easier to reach the estimate. It’s almost unavoidable in a large firm because budget participation allows one to influence the standard by which his or her own performance is later evaluated.
Budget slack distorts the knowledge shared in a budget. It is a form of waste within the firm.
9.2.4 Minimizing Budget Slack
Firms can make several tradeoffs to minimize budget slack. All of them weaken the budget’s role in performance evaluation in the interest of encouraging a better-informed budget.
One thing a firm can do, for example,
The firm could also de-emphasize meeting or beating budgeted numbers, perhaps replacing objective quantitative performance metrics with qualitative and subjective ones. Subjective performance evaluation, however, could lead to other forms of waste, such as pandering (from subordinates) and undue leniency (from supervisors).
Or if the firm prefers to stick with quantitative metrics, it could use external benchmarks instead. The downside of this is the risk of tying performance evaluations to peer firms that are not a good match. If the benchmarks are too far out of reach, the evaluation will seem unfair. If the benchmarks are too easy, the evaluation will not motivate one’s best effort.
9.3 Example Budgets
9.3.1 General Description and Assumptions
In this section, I provide example budgets. These budgets are meant to illustrate some general characteristics of common budgets. Budgets vary greatly in practice because firms themselves vary greatly and budgets are based on a firm’s knowledge of itself and the future.
Notice how many different assumptions each budget relies on. Each assumption is a form of knowledge. This is what I mean when I say the budget is a knowledge sharing device. Each of these assumptions has to be extracted from the part of the firm that knows the most about that particular driver of revenue or cost.
In these budgets, I assume absorption costing. With minor adjustments to the budgets that consider product cost (e.g. the overhead budget, the finished goods inventory budget, the budgeted balance sheet, etc.), a firm could use roughly the same procedures to produce a non-absorption budget.
9.3.2 Operating Budget
An operating budget covers the operating cycle of the firm, almost always one-year. In contrast, a capital budget covers a longer period of time, five, ten, even twenty years. It is designed to capture the long-term outcomes of capital projects and capital assets. I cover capital budgets in the next sub-section.
An operating budget is sometimes called a master budget. It is made up of several sub-budgets.
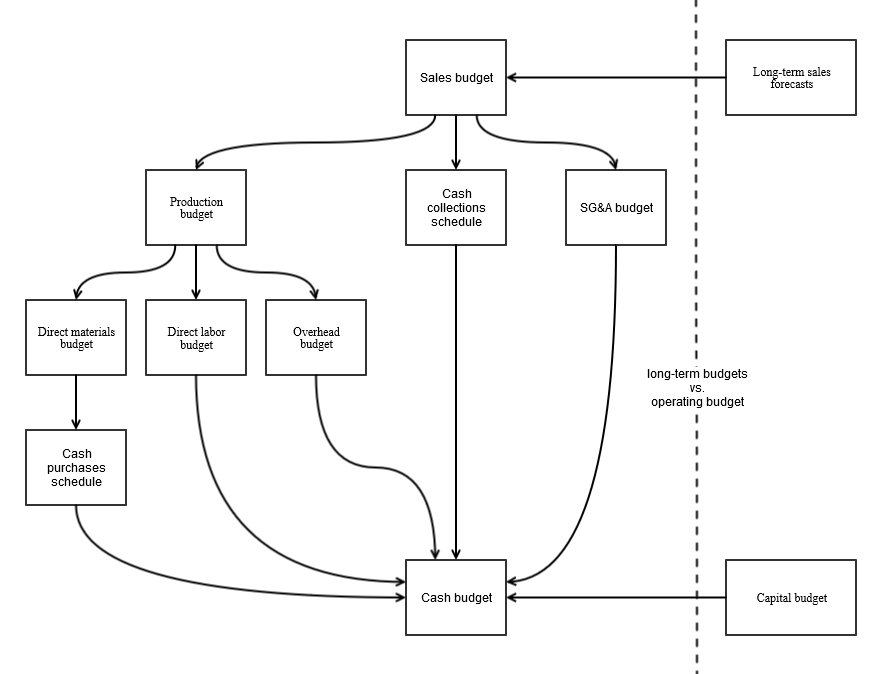
Operating budgets begin with assumptions about long-term sales trends and the effect those trends will have on the upcoming operating cycle. These assumptions provide the firm with the information needed for the sales budget.
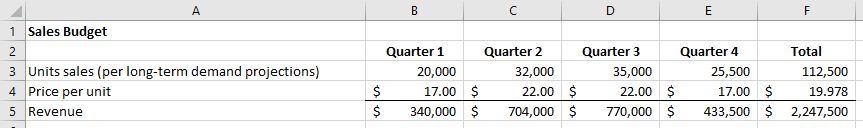
The sales budget is relatively straightforward in this example, in part because this is a single product firm. In a multi-product firm, multiple prices and a budgeted sales mix would be included in the sales budget as well.
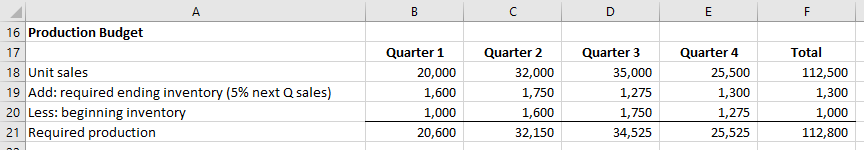
Assuming the firm extends credit to customers, the sales budget is almost always accompanied by a cash collections schedule, which translates revenue dollars into cash collected. This schedule follows the firm’s assumtions for accounts receivable aging and collectability.
Without this
I’ve assumed sales revenue from Quarter 4 last year (i.e. 20% of $250,000 in cell B9). The firm’s accounts receivable assumptions are expressed in cell A8.
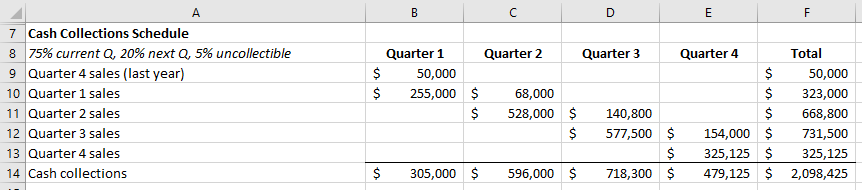
From the sales budget, a manufacturing or service firm creates the production budget. Merchandise firms move on to a purchasing budget instead, which has the same ultimate purpose: predicting values for inventory, cost of goods sold, and cash outflows.
The production budget is complicated by a firm’s finished goods inventory policy. Often a firm will have a policy of maintaining a set percentage of next period’s sales in finished goods inventory at the end of this period. That policy affects how many units the firm must produce this period.
In this
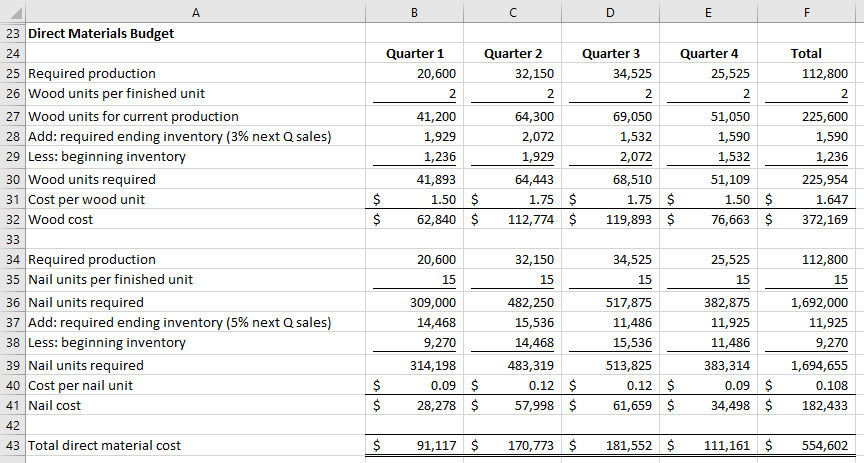
Once the firm has production budgeted, it can budget the inputs of production: direct materials, direct labor, and overhead.
The direct materials budget is similar to the production budget but with two additional wrinkles.
Similar to finished goods units, firms often have a policy for ending direct materials inventory each period. This example uses the policy that ending direct materials inventory be equal to 3% of the direct materials units needed for next quarter’s production.
This example also uses two different direct materials: wood and nails. I’ve assumed required production for Quarter 1 of the next year (i.e. 3% of direct materials units required for 26,500 in cells E28 and E37).
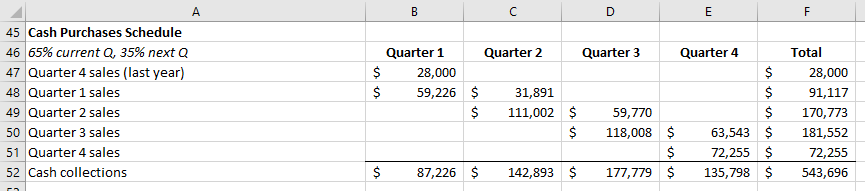
Assuming the firm is able to purchase direct materials on credit from suppliers, the direct materials budget is accompanied by the cash purchases schedule. In order to complete the cash budget later, the firm needs information on cash disbursements from direct materials purchases. This schedule follows the firm’s estimates for accounts payable aging.
I’ve assumed direct materials purchases from last year (35% of $80,000 in cell B47). Accounts payable assumptions are expressed in cell A46.
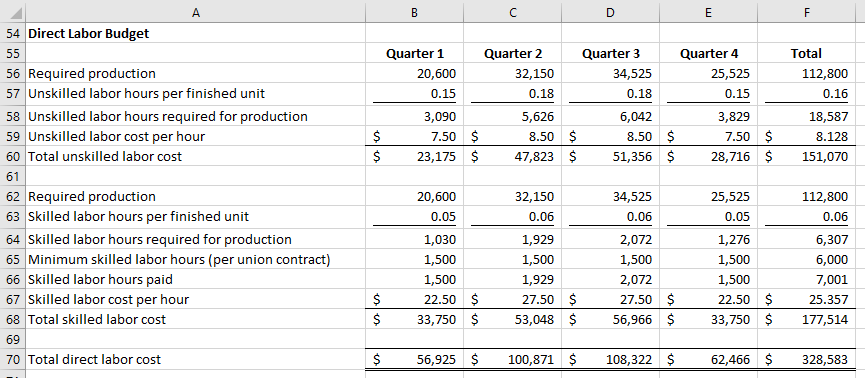
The direct labor budget, traditionally, estimates direct labor hours based on production. Many firms now treat direct labor as a fixed cost, making this approach unnecessary. Also, the firm might have to incorporate collective bargaining agreements into the budget. These agreements often mandate a minimum number of hours that workers are paid for.
This direct labor budget example uses two types of workers, one of which has a minimum number of hours they are paid for (see rows 64 through 66).
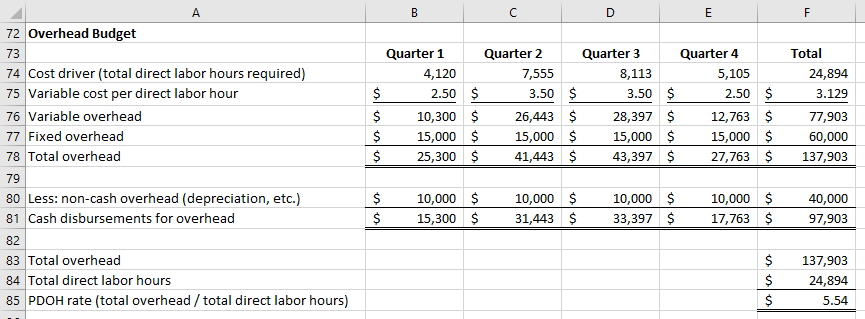
To create the overhead budget, a firm estimates variable overhead cost per unit and also estimates total fixed overhead cost. The firm’s PDOH rate is calculated by dividing the total budgeted overhead number for the period by the budgeted cost driver units for the period. (see cells F83 through F85)
I use total direct labor hours as the cost driver for this overhead budget.
Now that these three types of product costs are budgeted, the firm can develop a cost per unit number, which in turn allows the firm to estimate the dollar value of finished goods inventory in the finished goods inventory budget.
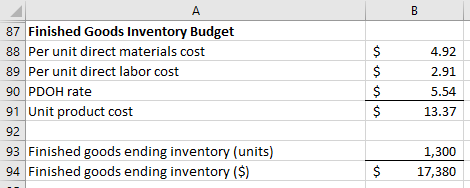
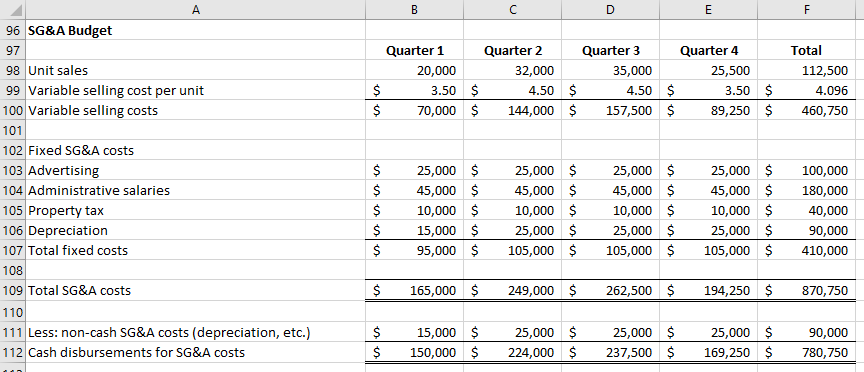
The firm still needs to consider SG&A costs. So it produces the SG&A budget. There may be a variable component to these costs (usually variable selling costs), similar to the overhead budget. Unlike the overhead budget, though, the variable selling cost numbers are probably based on the number of units sold, from the sales budget (variable overhead was based on the number of units produced, from the production budget).
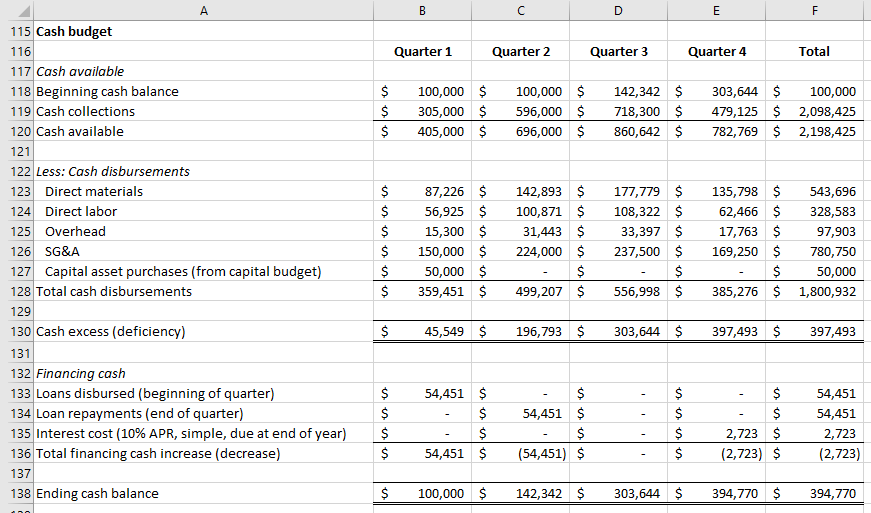
Now the firm can produce the cash budget. This budget takes into account cash collections, cash disbursements, and also takes input from capital purchases. Within the cash budget the firm will add loaned cash, if cash get too low, and loans being paid back, as soon as cash rises again.
In this example, the firm begins with $100,000 in cash. $100,000 is the floor for ending cash balance each quarter. If cash would otherwise go below that floor, the firm will borrow enough cash (at 10% APR) to reach $100,000. I use simple interest in this example.
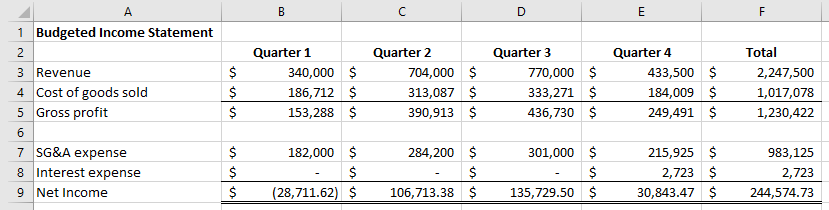
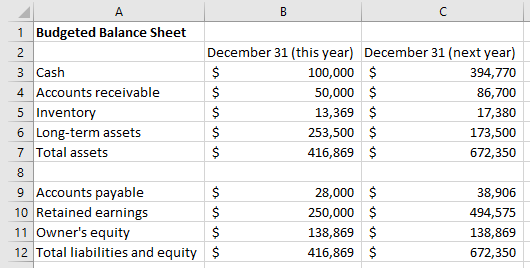
From the collective information in all the above budgets, the firm can produce a budgeted income statement and a budgeted balance sheet. (The firm can produce budgeted versions of all the financial statements at this point, but these two are the most important for our purposes.)
9.3.3 Capital Budgets
“Capital,” at its core, is a noun that generally means “cash.” But when “capital” is used as an adjective, it effectively means “long-term.” This makes sense: the long-term nature of some projects and assets, i.e. capital projects and capital assets, creates the unique problem of having your capital, i.e. cash, tied up for a long time. Having cash tied up like that becomes a defining characteristic of those projects and assets. Thus “capital” is important to these projects and assets per se.
Time for a critical distinction. A capital budget, as I use the term, reflects the totality of long-term projects undertaken by a firm, region, division, or department. Often the present value calculations go on in the background in such a capital budget.
Capital budget: A projection of cash inflows and outflows for all capital projects and capital assets within the firm, region, division, or department.
But a lot of times people talk about capital budgeting and they mean something much more limited: evaluating a single project or asset that stretches over the long-term. So I’ll use the following definition to differentiate this alternative mindset.
Capital budgeting: Analysis of the projected cash inflows and outflows for a single capital project or capital asset, usually with the object of evaluating its overall profitability.
A good capital budget (i.e. a capital budget with a highly profitable set of capital projects and assets) requires a lot of capital budgeting (i.e. a careful evaluation of the long-term cash picture for each of these projects and assets).
Capital budgeting is related to strategic cost management from Chapter 2. Capital budgeting focuses on long-term assumptions about cash inflows and outflows. Strategic cost management weighs strategic factors that affect long-term profitability, not all of which are easily quantified. Put this way, capital budgeting is a sub-category of strategic cost management: it’s strategic cost management for projects and assets with quantifiable long-term cash inflows and outflows. Relevant cost analysis, also from Chapter 2, similarly relates to operating budgets. Relevant cost analysis tends to focus on short-term revenue and cost, just like the numbers reported in an operating budget.
I focus on capital budgets in this Section 9.3. In the next section, Section 9.4, I cover a variety of capital budgeting tools such as net present value, internal rates of return, payback time (discounted and non-discounted), and accounting rate of return.
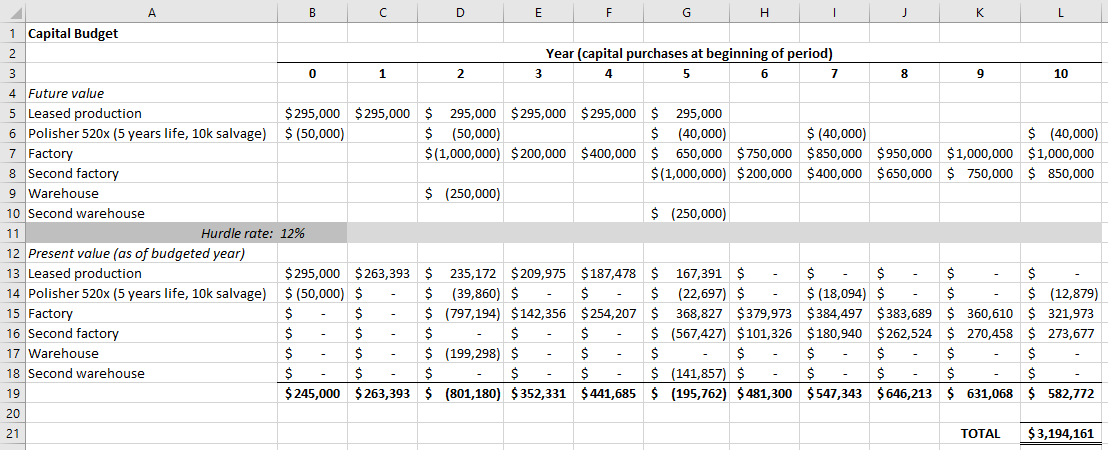
This simple capital budget shows the operating budget year as Year
The budget tells a story of expansion. The firm currently leases its facility. After a few
Great story. But is it true?
9.3.4 Sensitivity Analysis
9.3.4.1 Uncertainty in budgeting
Every budget is a guess.
Think about it. Do you know the future? (If you do, what are you doing here, Biff?) You leave for work at the normal time because you think traffic will be normal today (yeah right!). You don’t study for your cost accounting class because you think the test will be easy (good luck!). You put off going to the gym because you tell yourself you’ll do it tomorrow (just stop it already!).
Okay, the point is a budget is just a best guess, like the guesses you make in everyday life. You make your best guess, and you update it as you go along. And you shouldn’t really be surprised that some your guesses are wrong. Most times getting something wrong about the future has little impact. Sometimes it is very impactful, even life-changing.
I bet you would prefer to know when a guess you’re making has potentially life-changing downside risks. So do most firms. That’s why they perform sensitivity analysis.
Sensitivity analysis is when the firm changes an assumption underlying the budget and checks how budgeted firm outcomes would change as a result of that assumption change. In other words, it tests the firm’s budgeted sensitivity to that assumption.
Sensitivity analysis estimates the impact if one or more of the firm’s budget guesses are wrong. It isn’t perfect. Adjusting one assumption still leaves in place lots of other assumptions about the future. If the budget as a whole has systemic assumptions that are bad, sensitivity analysis does little to root out these bad assumptions. Sensitivity analysis does little to predict black swan events or the effect such events might have on the firm.
Operating budgets and capital budgets use different types of sensitivity analysis because they differ in their time horizon.
The further into the future a firm budgets, the less reliable its assumptions. The information the budget is based on may be solid for today’s operations. But over time the underlying facts can change, and the firm’s information can become outdated. The longer the time horizon the greater the risk that the budget’s information becomes outdated and its assumptions don’t hold.
9.3.4.2 Flexible Budgets
Operating budgets typically use a very simple type of sensitivity analysis: budget flexing. I already mentioned flexible budgets in Chapter 7. I described them as a performance evaluation tool. That is true. Backward-looking flexible budgets are essential for variance analysis.
The firm can also produce a forward-looking flexible budget. It can do this by simply changing the volume assumptions in the sales budget. This produces a flexible budget that helps the firm to see how close it is to margin of safety or breakeven.
Other parts of the operating budget could also be flexed, such as modified collection policies, ending inventory levels, or variable overhead rates. But this is less common and usually less necessary. For many firms the main uncertainty over the next year is sales volume.
Here are the income statement and balance sheet if the firm sells 25% less than previously expected (i.e. a flexible budget at 25% lower sales volume).
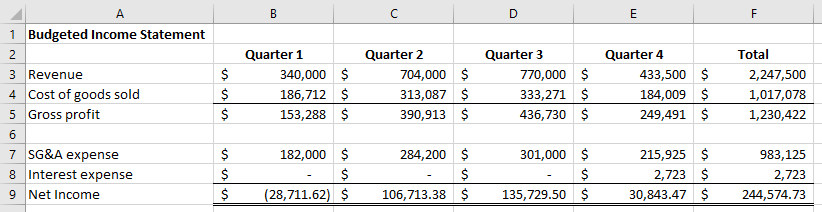
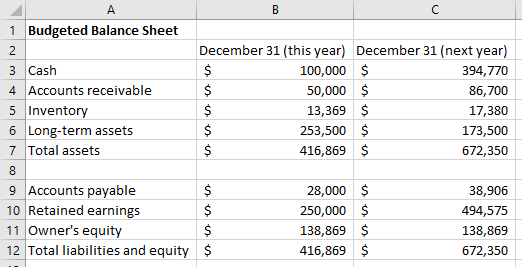
And here are the income statement and balance sheet if the firm sells 25% more than previously expected (i.e. a flexible budget at 25% higher sales volume).
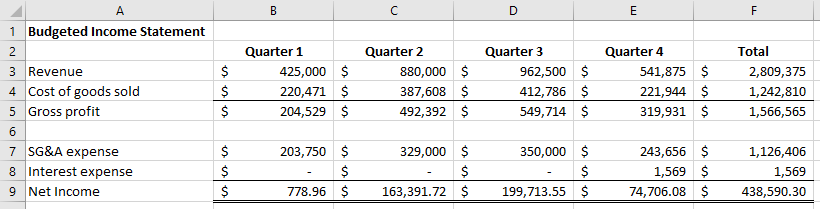
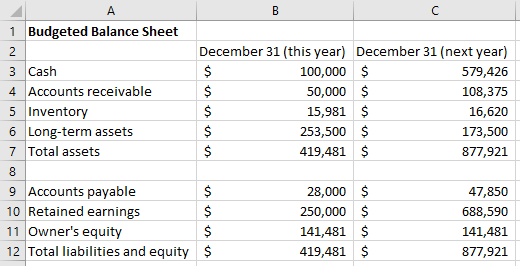
By looking at these numbers the firm can examine the impact of sales volume uncertainty and decide if it is a big deal (requiring risk management) or something minor (not worth worrying about).
9.3.4.3 Capital Budget Sensitivity Analysis
Capital budgets, especially for complex projects, require more extensive sensitivity analysis. The firm may flex a great number of assumptions, including investment and payoff timelines and amounts, interest rates, the effectiveness of future operations, and salvage value.
There’s a tradeoff though. The more sensitivity analysis you perform, the harder it is to use that analysis for decision making. It quickly becomes a sea of possibilities that isn’t manageable or actionable.
You should pick a handful of assumptions to flex based on which assumptions are (1) the most uncertain and (2) the most impactful. Then you flex them at the most likely and impactful levels. This helps you manage your sensitivity analysis. It accounts for the most important forms of uncertainty while still being actionable.
Consider, for example, the sensitivity analysis below. The first two sets of discounted cash flows (rows 11 through 32) measure the net present value over the next 10 years with different hurdle rates: 14% and 10%, respectively. The third and fourth (rows 33 through 54) check sensitivity to assumptions related to the Polisher 520x, specifically its salvage value and useful life.
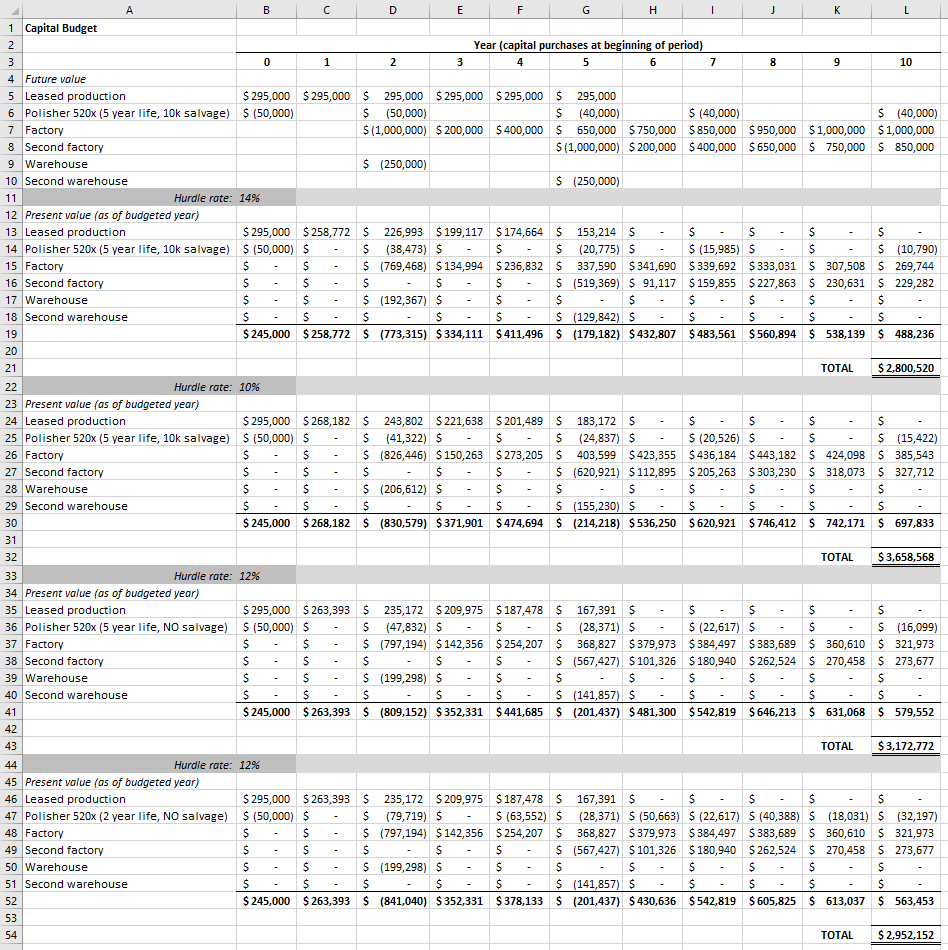
Are these the most important values to check sensitivity for? Maybe. Maybe not. What about the assumption of continued cash flow from leased operations? The number on the budget right now is just the first year’s cash flow copied into the next five years. That cash flow might change, especially with additional supply from the first factory in Year 2.
What about the ramp up in cash flow from the factories? Is $1,000,000 a realistic amount of cash flow from those factories? What obstacles might come up that keep the firm from reaching that level of cash flow or slowing its progress toward it?
Should the firm test all of these assumptions? At all hurdle rates? With all levels of Polisher 520x assumptions? That’s easily hundreds of thousands of possible outcomes. I would hope that checking so many alternative futures isn’t necessary. It certainly isn’t useful from a human decision making perspective. Select only the most important assumptions and don’t waste your time (or the firm’s time) chasing after every assumption.
9.4 Capital Budgeting
[This section to be continued in the future]